
Blog · 2026-07-26 · Vynaris Team
When the pricier sticker is cheaper per task: token efficiency vs the effort dial for Fable 5 and Opus 4.8
A 2x sticker can be cheaper per task: Fable 5 beats Opus 5/4.8 only above a 2.0x token-efficiency break-even; never on input-heavy work. (2026-07-26)
A model with double the sticker price can still cost less per task. Fable 5 lists at $10/$50 per million tokens, exactly 2x Opus 5 and Opus 4.8 at $5/$25. It wins on cost per task only when it finishes the same job in fewer tokens: at least 50% fewer across input and output combined. Below that bar, the cheaper sticker wins. Prices verified 2026-07-26.
TL;DR
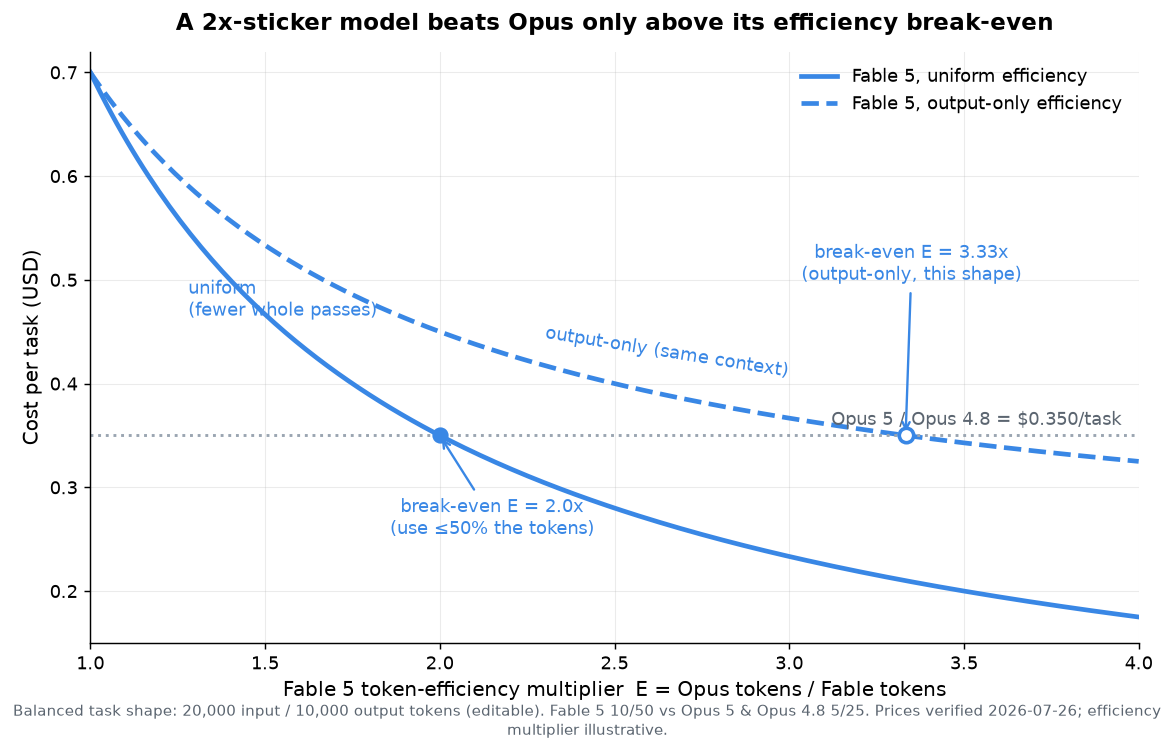
- If Fable 5 is uniformly more token-efficient (fewer whole passes, so both input and output shrink), the break-even is exactly the sticker ratio: it must use 50% of Opus's total tokens to tie, fewer to win. This holds for every task shape.
- If the efficiency is output-only (same context, tighter reasoning), the break-even is steeper and depends on the shape: 2.22x on an output-heavy task, 3.33x on a balanced one, and impossible on an input-heavy one, where Fable's 2x input tax alone is 1.33x the entire Opus bill.
- On a balanced 20k-in/10k-out task at a 2.5x efficiency gap, uniform efficiency puts Fable 5 at $0.28/task versus Opus at $0.35 (-20%), while output-only efficiency leaves it at $0.40 (+14%). Same gap, opposite verdict, because of where the tokens are saved.
Where the claim comes from
Cognition reported that Devin now runs Fable 5 at a lower cost per task than Opus 4.8 despite Fable's higher sticker, crediting delegation and shorter reasoning chains that close the task in fewer tokens (source; third-party, we could not page-verify the engagement or the per-task figures, so none of them feed the math below). The claim is plausible and worth modeling, because a 2x sticker inverting on cost is exactly the kind of number a team repeats without checking the condition attached to it.
That condition is a token-efficiency multiplier, and it is a different lever from the effort setting we covered in the Opus 5 vs Fable 5 effort comparison. That post held tokens matched at each effort rung and found Fable a flat +100%; it only came out ahead by dropping effort notches, which trades quality for tokens. This post relaxes the matched-token assumption and asks a separate question: at equal quality, how much more token-efficient must the pricier model be to pay for its own sticker?
What we computed and why
Define the efficiency multiplier E = Opus_tokens / Fable_tokens. E = 1 means both models spend the same tokens on the task; E = 2 means Fable finishes in half the tokens. We solve for the break-even E* where Fable 5 cost per task equals Opus cost per task, using live-verified rates and one editable set of task shapes.
The assumptions are yours to change; swap your own trace medians in.
Task shape                 Input tokens  Output tokens  in:out  Opus 5 / 4.8 cost
-------------------------  ------------  -------------  ------  -----------------
Output-heavy (reasoning)   10,000        20,000         0.5     $0.5500
Balanced                   20,000        10,000         2.0     $0.3500
Input-heavy (agent / RAG)  60,000        6,000          10.0    $0.4500
Opus 5 and Opus 4.8 are the same line to the cent, so every row applies to both. All arithmetic is in token-efficiency-inverts-cost-per-task-fable-5-vs-opus-48-math.py.
The clean case: uniform efficiency breaks even at the sticker ratio
Suppose Fable's efficiency comes from doing fewer whole passes: better delegation means fewer agent loops, so both the input tokens it re-reads and the output tokens it emits fall by the same factor E. Then the algebra collapses:
Fable_cost = (1/E) * (I * $10 + O * $50)
           = (1/E) * 2 * (I * $5 + O * $25)
           = (2 / E) * Opus_cost
Break-even is 2 / E = 1, so E* = 2.0. The task shape cancels out. Fable 5 must use half of Opus's total tokens to tie, and anything below half is profit. At a 2.5x gap on the balanced shape, Fable lands at $0.28 against Opus's $0.35, a 20% saving. This is the regime the Devin claim would live in, because delegation removes passes rather than just trimming answers.
The harder case: output-only efficiency is shape-dependent, sometimes impossible
Now suppose Fable reads the same context (same input) but writes a tighter answer with fewer reasoning tokens. Only the output shrinks. The break-even becomes:
E* = 2 * O * $25 / (O * $25 - I * $5)The denominator is the problem. Fable still pays 2x on the full input block, and that tax comes out of the same budget. Results by shape:
Task shape                 Break-even E* (output-only)  Break-even E* (uniform)
-------------------------  ---------------------------  -----------------------
Output-heavy (reasoning)   2.22x                        2.00x
Balanced                   3.33x                        2.00x
Input-heavy (agent / RAG)  impossible                   2.00x
On the input-heavy shape the denominator goes negative, which means no amount of output efficiency can rescue Fable. Proof: Opus does the whole task for $0.4500; Fable 5 with zero output tokens still pays $0.6000 just for the 2x input tax on 60,000 tokens. That floor is 1.33x the entire Opus bill. When your input dwarfs your output, the pricier model cannot win on output efficiency alone; it has to cut input passes too, which is the uniform case.
If you want to test your own numbers, the cost calculator takes the input and output token counts for a task; enter Opus's counts, then Fable's, and compare the two totals directly.
What it means for routing
The instinct to sort a model routing table by sticker price is wrong in both directions here, and the fix is to measure two things per model, not one.
- Measure tokens per task, not just price per token. The sticker is cost per token; the bill is cost per task. A frontier model that closes tasks in fewer passes can undercut a cheaper model that flails. You cannot see this on a price sheet.
- Know which kind of efficiency you are buying. Ask whether the expensive model saves input passes (uniform, break-even 2.0x) or only trims output (break-even 2.2x to impossible). Agent workloads with large fixed context are the case where output efficiency is worth the least, because the input tax is fixed and doubled.
- Route by workload shape. Output-heavy reasoning tasks give the pricier model the easiest path to break-even. Input-heavy retrieval and long-context agent turns give it the hardest, often impossible, path. Split your traffic by shape before you pick.
Prompt caching does not change any of this. Cache reads bill at 0.1x of input on both models, so the 2x ratio survives the discount: at an 80% cache-read rate the balanced task is $0.278 on Opus and $0.556 on Fable at matched tokens, still exactly 2x. Caching scales both columns; it does not move the break-even.
Caveats and where we are wrong
- The efficiency multiplier is not knowable from a spec sheet. You get it only by running the same task set through both models and counting tokens. A vendor's per-task number is their workload, not yours.
- Efficiency and quality are separate axes. A model that finishes in fewer tokens but fails more often costs more once you add retries. Bake your retry rate into the token count before comparing.
- The three shapes are illustrative. The uniform break-even is exact at 2.0x regardless, but the output-only break-even moves with your real in:out ratio. Use the script, not our rows.
- We modeled the standard tiers. Fast mode ($10/$50 on Opus 5 and 4.8) closes the sticker gap entirely, at which point Fable at standard speed and Opus at fast speed cost the same and the efficiency question resets. See the effort comparison for that path.
FAQ
Can a model with a higher sticker price ever be cheaper per task? Yes, if it finishes the task in fewer tokens. For Fable 5 versus Opus 5/4.8, the sticker is 2x, so Fable must use at most half the total tokens (a uniform efficiency of 2.0x) to tie, and fewer to win.
Why is the break-even sometimes 2.0x and sometimes 3.33x? It depends on where the tokens are saved. If both input and output shrink together, the break-even is the sticker ratio exactly, 2.0x. If only output shrinks while input stays fixed, Fable still pays the doubled input tax, so it needs a larger output cut, 3.33x on a balanced task.
When can the pricier model never win? On input-heavy work. If your input is large relative to output, Fable's 2x input charge alone can exceed the whole Opus bill. On our 60k-in/6k-out shape, Fable costs 1.33x the entire Opus task before writing a single output token.
How is this different from the effort setting? The effort dial changes how many tokens one model spends and trades quality for cost; you choose it. Token efficiency is a property of the model at equal quality; you measure it. They are separate levers and can point in opposite directions.
How do I find my own efficiency multiplier? Run a representative task set through both models, record input and output token counts per task from the usage object, and take the ratio of Opus tokens to Fable tokens. Compare that to the break-even for your in:out shape.
Sources
- Anthropic pricing (Fable 5 $10/$50, Opus 5 and Opus 4.8 $5/$25, cache read 0.1x, cache write 1.25x, fast mode $10/$50), verified live 2026-07-26: https://platform.claude.com/docs/en/about-claude/pricing
- Anthropic, Claude Opus 5 launch announcement (2026-07-24): https://www.anthropic.com/news/claude-opus-5
- Cognition, Devin running Fable 5 at lower cost per task than Opus 4.8 (third-party claim, not page-verified; no figures used in the math): https://x.com/cognition/status/2076714965344342382
- All arithmetic, editable inline:
token-efficiency-inverts-cost-per-task-fable-5-vs-opus-48-math.py
Related: Opus 5 vs Fable 5 vs Opus 4.8 effort settings · Opus 5 re-route analysis · GLM-5.2 vs Opus 4.8 vs GPT-5.5 · What a coding agent costs per task across 6 models
Further reading: Muse Spark 1.2's $0.40 task-cost claim and token-volume break-even.