
Blog · · By Dhrumil Barot, Founder
Qwen3.6-27B: a 10% failure rate adds 11.1% per correct task
At a 10% failure rate, Qwen3.6 tool calls cost 11.1% more per correct task. See the retry math and controlled runtime evidence.
A 10% tool-call failure rate turns 1,000 correct outcomes into 1,111 attempts, raising compute cost 11.1%. A controlled Qwen3.6-27B experiment proves runtime and quantization choices can change tool calls. It does not measure a 10% fleet failure rate. Prices verified 2026-08-24; no provider price is used.
TL;DR
- One public experiment held Qwen3.6-27B weights, prompt, GPU, software, and cache precision constant while changing the attention backend. The resulting branches included repeatable wrong or malformed tool calls.
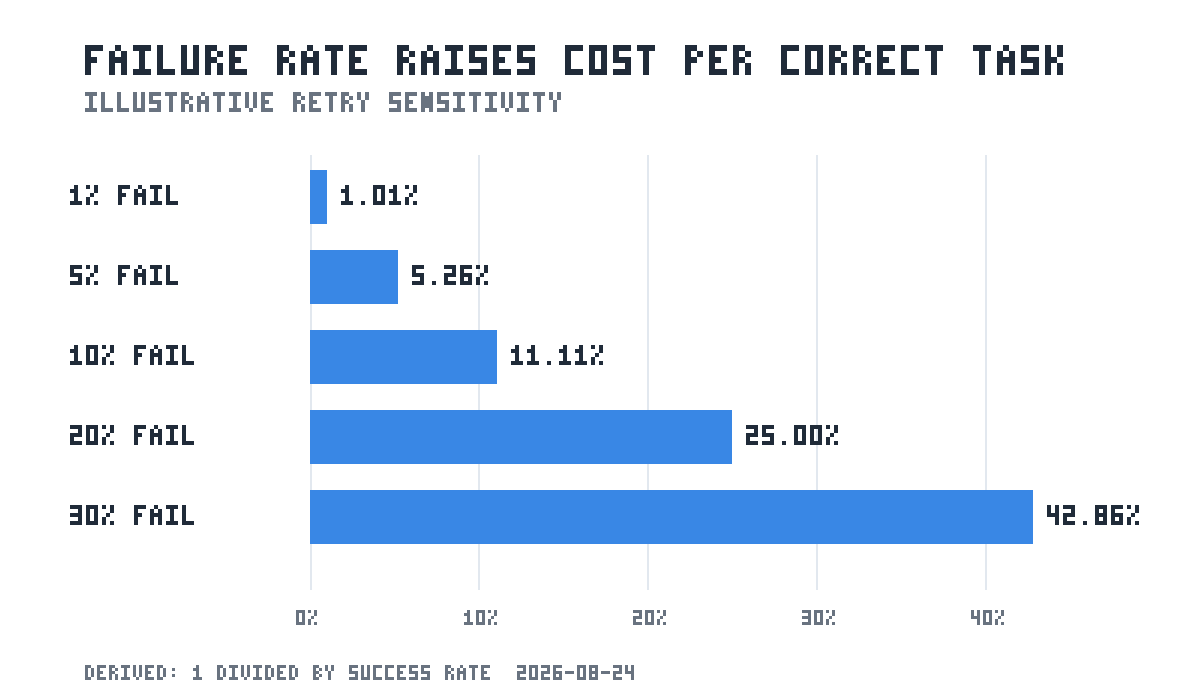
- A failure rate of 1%, 5%, 10%, 20%, or 30% adds 1.01%, 5.26%, 11.11%, 25%, or 42.86% to nominal attempt cost when retries continue until success.
- Those rates are sensitivity cases. The experiment reports specific failures, not an aggregate production failure rate.
- Measure dollars per correct task on your own workload before picking a quant, backend, or tensor-parallel layout.
Verdict table
| Illustrative failure rate | Attempts / correct task | Extra attempts / 1,000 correct | Cost multiplier | Cost / 1,000 correct at $0.10 per attempt | Decision |
|---|---|---|---|---|---|
| 0% | 1.0000 | 0.0 | 1.0000x | $100.00 | Sticker cost is outcome cost |
| 1% | 1.0101 | 10.1 | 1.0101x | $101.01 | Often below measurement noise |
| 5% | 1.0526 | 52.6 | 1.0526x | $105.26 | Fidelity belongs in cost review |
| 10% | 1.1111 | 111.1 | 1.1111x | $111.11 | An 11.1% speed win only breaks even |
| 20% | 1.2500 | 250.0 | 1.2500x | $125.00 | Cheap attempts can be expensive outcomes |
| 30% | 1.4286 | 428.6 | 1.4286x | $142.86 | Fix correctness before scaling |
Every rate in this table is illustrative. The $0.10 attempt cost is also an editable unit, not a reported Qwen hosting price. Replace it with your GPU, energy, and operator cost per attempt.
What the public experiment actually found
The Level1Techs experiment used the official BF16 Qwen3.6-27B checkpoint on one RTX PRO 6000 Blackwell GPU. The first test used BF16 weights and a BF16 KV cache. It pinned a nightly vLLM build and disabled CUDA graphs, prefix caching, and MTP.
The workload was a roughly 100,000-token context from a real network-engineering workstream. It contained multiple tool calls and work products. Three attention backends processed the same forced token history: FlashAttention 2, Flash Inference, and Triton Attention. The backend was the only changed setting in that comparison.
That control matters. The author reports bit-identical results across repeated runs using the same backend. Different backends began choosing different top tokens later in the long context. Branching from selected differences produced visible task failures. One FlashAttention 2 branch targeted the wrong Cisco interface, then issued the wrong command again. Another failed an interface-description task.
The quantization comparison held the context window and BF16 cache constant. BF16, FP8, INT8, NVFP4, and AWQ W4A16 variants processed the same workload. The post reports that NVFP4 and AWQ W4A16 failed to close tool calls and used show run where the correct command was show arp; FP8 and INT8 completed those calls.
This is strong evidence that an inference stack is part of model behavior. It is not a fleet benchmark. One prompt, selected branches, and a handful of failures cannot supply a general 5%, 10%, or 20% failure rate.
The distinction between token divergence and task correctness is equally important. A different top token can recover. A BF16 continuation can still be wrong. The author explicitly describes BF16 as a numerical-fidelity reference, not a correctness oracle. Labelled answers or executable tool-call checks decide the outcome.
The cost-per-correct-task equation
Nominal cost per task counts every attempt as if it succeeds. Outcome-normalized cost divides by the success rate:
success rate = 1 - failure rate
attempts per correct task = 1 / success rate
cost per correct task = nominal attempt cost / success rate
At a 10% failure rate, the success rate is 90%. The expected attempts per correct task are 1 / 0.90 = 1.1111. A $0.10 attempt therefore becomes $0.10 / 0.90 = $0.1111 per correct task. Across 1,000 correct tasks, cost rises from $100 to $111.11.
The cost increase is not the failure percentage itself. Ten percent failure adds 11.11%, because retries also consume attempts. Twenty percent adds 25%. Thirty percent adds 42.86%.
This simple model assumes independent retries with the same cost and success probability. It excludes human recovery, damaged external state, and retries that make later attempts harder. Those omissions usually make the table a floor for tool-using agents.
The reproducible script and downloadable CSV live beside this article. Use the LLM cost calculator to price the token portion of one attempt, then multiply that result by the table's outcome factor. For self-hosted inference, divide fully loaded GPU and energy cost by completed attempts before applying the same correction.
Why price per million tokens is missing
Qwen publishes weights, not a universal hosted tariff. A local run's cost per million tokens depends on GPU purchase or rental cost, utilization, power, throughput, batching, and operations. The experiment publishes a roughly 100,000-token prompt, but not output tokens, joules, throughput, or a hardware invoice.
Inventing a dollar-per-million rate would make the article look complete and make the math false. Start from your measured per-request cost. The retry multiplier then works for any token price or infrastructure stack.
Our self-hosting break-even analysis shows how utilization changes owned-hardware economics. The 30x coding-agent token study shows why the attempt shape must also come from the target workload. Neither number can be borrowed safely for this network-automation trace.
The buyer threshold
Suppose a lower-precision setup cuts nominal attempt cost by 10%. It costs 0.90x the baseline before quality adjustment. Its break-even success rate is 90%, because 0.90 / 0.90 = 1.00. A failure rate above 10% erases the saving.
The general threshold is direct:
cheaper setup wins when:
candidate cost ratio / candidate success rate
< baseline cost ratio / baseline success rate
If the baseline succeeds 99% of the time and the candidate costs 20% less, the candidate breaks even at 0.80 × 0.99 = 79.2% success. That is a 20.8% maximum failure rate under equal retry cost. The arithmetic does not say that a 20.8% failure rate is safe. It only locates the compute-cost crossing.
Tool damage can move the real threshold sharply. A malformed JSON envelope may fail cheaply. A wrong router command may require rollback, operator review, or incident response. Attach a recovery cost to each failure class instead of treating all failures as equal.
What to test before changing the inference stack
Start with task-level acceptance checks. Exact tool names, arguments, interface identifiers, SQL, and JSON closure are stronger labels than average token agreement. Include long contexts that resemble production. The public experiment saw divergence appear later in its roughly 100,000-token prompt.
Change one variable at a time: weight quantization, cache precision, attention backend, tensor parallelism, driver, or GPU family. Record the entire runtime fingerprint with every result. vLLM documents that backend selection depends on hardware, data type, cache type, block size, and other constraints in its attention backend guide.
Run repeated deterministic cases before broader sampling. Then use an A/B test on labelled tasks and report confidence intervals. Track at least four values per configuration:
- nominal dollars per attempt;
- correct outcomes divided by attempts;
- dollars per correct outcome;
- recovery dollars and human minutes per failed outcome.
That measurement also informs quality-aware routing. A cheaper quant can handle forgiving prose while an exact tool call stays on a higher-fidelity path. Route by the failure consequence, not by token count alone.
Honest tradeoff
Do not reject quantization because one controlled workload exposed failures. The same post reports FP8 and INT8 completing tool calls that two lower-precision variants missed. Lower precision can reduce memory demand and increase throughput without breaking your workload.
Do not accept a quant because a generic benchmark barely moves either. Long-context tool use, exact literals, and your runtime stack may expose a different weakness. The right choice is the cheapest configuration that passes task-level acceptance tests with enough margin for production drift.
For low-volume, human-reviewed tasks, building a large evaluation harness may cost more than the saved compute. Keep the safer configuration and revisit after volume makes the decision material. For unattended network, payment, or database tools, the recovery tail can justify the test before the first production run.
Caveats and where this model is wrong
- The public experiment is one hardware and workload setup. It shows causality for selected runtime changes, not prevalence across Qwen deployments.
- The 1% through 30% rates are scenarios. None is attributed to the experiment.
- Retrying until success assumes failures are detectable. Silent wrong tool calls need outcome checks before this formula applies.
- Retries may not be independent. A damaged environment or retained bad context can make the next attempt worse.
- The $0.10 attempt is a teaching unit. It is not a Qwen price or a measured infrastructure bill.
- Cost per correct task omits latency, operator time, and external damage unless those costs are added explicitly.
FAQ
Did the experiment find a 10% Qwen3.6-27B failure rate? No. It demonstrated specific, repeatable tool-call failures under selected backend and quantization changes. Ten percent is an illustrative input to the cost model.
Why can the same weights produce different tool calls? Different kernels and numeric formats can shift logits. A changed top token can send autoregressive generation down another path. The public control held the weights and prompt constant while changing the attention backend.
Is BF16 always correct? No. It is the experiment's numerical reference, not a semantic oracle. Correctness needs labelled answers or executable checks.
When does a 10% cheaper setup stop saving money? Under equal retry cost and a perfect baseline, it stops winning at a 10% candidate failure rate. With a 99% baseline success rate, compare both outcome-normalized costs instead.
Should every local deployment avoid NVFP4 or AWQ? No. The failures belong to this checkpoint, runtime, hardware, and workload combination. Test the exact stack and tasks you intend to run.
Sources
- Level1Techs controlled Qwen3.6 experiment, model setup, backend control, selected quantizations, and tool-call outcomes captured 2026-08-24.
- Official Qwen3.6-27B model page, model name and checkpoint verified 2026-08-24.
- Official Qwen3.6-27B-FP8 model page, official FP8 checkpoint name verified 2026-08-24.
- vLLM attention backend documentation, backend-selection constraints verified 2026-08-24.
- Hacker News discussion, used only as public demand evidence; captured 2026-08-24.
The formulas, scenario table, chart, and CSV come from artifacts/qwen36-quantization-tool-call-failure-cost-per-correct-task-math.py. No Vynaris traffic, customers, telemetry, or routing logic appears in this analysis.