
Blog · · Updated · By Dhrumil Barot, Founder
The $0.0003 denominator missing from Neon and Castform: a 100x GPT-5.6 Sol claim audit
Neon implies $0.0003 per 4B retrieval request, but serving throughput, utilization, search fees, and training amortization remain unpublished.
Neon says a typical multi-turn GPT-5.6 Sol retrieval request costs about $0.03 and a post-trained 4B model is 100x cheaper. That implies $0.0003 per request. The post does not publish the 4B model's serving throughput, utilization, search bill, or training amortization, so the 100x cost claim cannot yet be reproduced.
Prices verified 2026-08-07.
TL;DR
- GPT-5.6 Sol has a $5 per 1M input token cost and a $30 per 1M output token cost. A 3,000-input, 500-output request costs exactly $0.03. That token shape is illustrative because Neon does not publish its shape.
- Dividing Neon's $0.03 by 100 yields a $0.0003 target, or $0.30 per 1,000 requests.
- An NVIDIA L4 at $0.57/hour needs 1.06 peak requests/second at 50% utilization to reach that GPU-only target. An A100 80GB at $2.10/hour needs 3.89.
- Those thresholds exclude database and search calls, network, redundant capacity, orchestration, and training amortization. Without them, “100x” is a hypothesis, not a reproducible cost result.
The verdict table
| Cost question | Published receipt | Reproducible result | Missing receipt |
|---|---|---|---|
| GPT-5.6 Sol token price | $5/1M input, $30/1M output | Live OpenAI rate | None |
| Typical Sol retrieval request | About $0.03 | Claimed by Neon | Input/output token shape and call count |
| Implied 4B target | 100x cheaper | $0.0003/request | None; this is $0.03 / 100 |
| L4 serving at target, 50% utilization | $0.57/GPU-hour | 1.06 peak requests/second | Measured production throughput |
| A100 serving at target, 50% utilization | $2.10/GPU-hour | 3.89 peak requests/second | Measured production throughput |
| Full 4B request cost | Not published | Cannot compute | Search, database, network, redundancy, training amortization |
The claim may be true. The public evidence does not let an engineering team prove it, budget it, or compare it with its own traffic.
Reconstructing the $0.03 Sol side
OpenAI lists GPT-5.6 Sol at $5 per 1M fresh input tokens and $30 per 1M output tokens for short-context standard processing. The per-request equation is:
cost = input_tokens x $5 / 1,000,000
     + output_tokens x $30 / 1,000,000
Several token shapes land on the same $0.03 bill.
| Input tokens | Output tokens | Sol cost/request |
|---|---|---|
| 0 | 1,000 | $0.0300 |
| 2,000 | 666.67 | $0.0300 |
| 3,000 | 500 | $0.0300 |
| 4,000 | 333.33 | $0.0300 |
| 6,000 | 0 | $0.0300 |
These rows are boundaries, not measurements of Castform's workload. A multi-turn retrieval loop may also repeat system instructions, tool results, and prior messages. The context window can make later turns cost more than earlier ones. Prompt-cache hits can make them cheaper. Neon's page reports the final $0.03 but not those components.
That omission does not invalidate the number. It prevents a reader from mapping the result to another workload. Our agent workflow forecast shows why call count and re-sent history can move cost faster than sticker price.
What 100x requires on a rented GPU
The implied target is simple:
$0.03 / 100 = $0.0003 per request
              = $0.30 per 1,000 requests
For self-hosted systems, the LLM inference cost from GPU rent is:
GPU cost/request = GPU dollars/hour
                 / (3,600 x peak requests/second x utilization)
E2E Networks lists an NVIDIA L4 24GB at $0.57/hour and an NVIDIA A100 80GB at $2.10/hour. Taxes are excluded. Solve the equation for the throughput vs. latency tradeoff required to hit $0.0003.
| GPU | 25% utilization | 50% utilization | 100% utilization |
|---|---|---|---|
| NVIDIA L4 24GB | 2.11 peak req/s | 1.06 peak req/s | 0.53 peak req/s |
| NVIDIA A100 80GB | 7.78 peak req/s | 3.89 peak req/s | 1.94 peak req/s |
The table does not assume that the 4B model achieves those rates. It defines the bar that a production benchmark must clear. At 50% utilization, an L4 running 0.5 peak requests/second costs $0.633 per 1,000 requests. That misses the implied target by 2.11x. At 2 peak requests/second it costs $0.158 per 1,000, about 47% below the target before other costs.
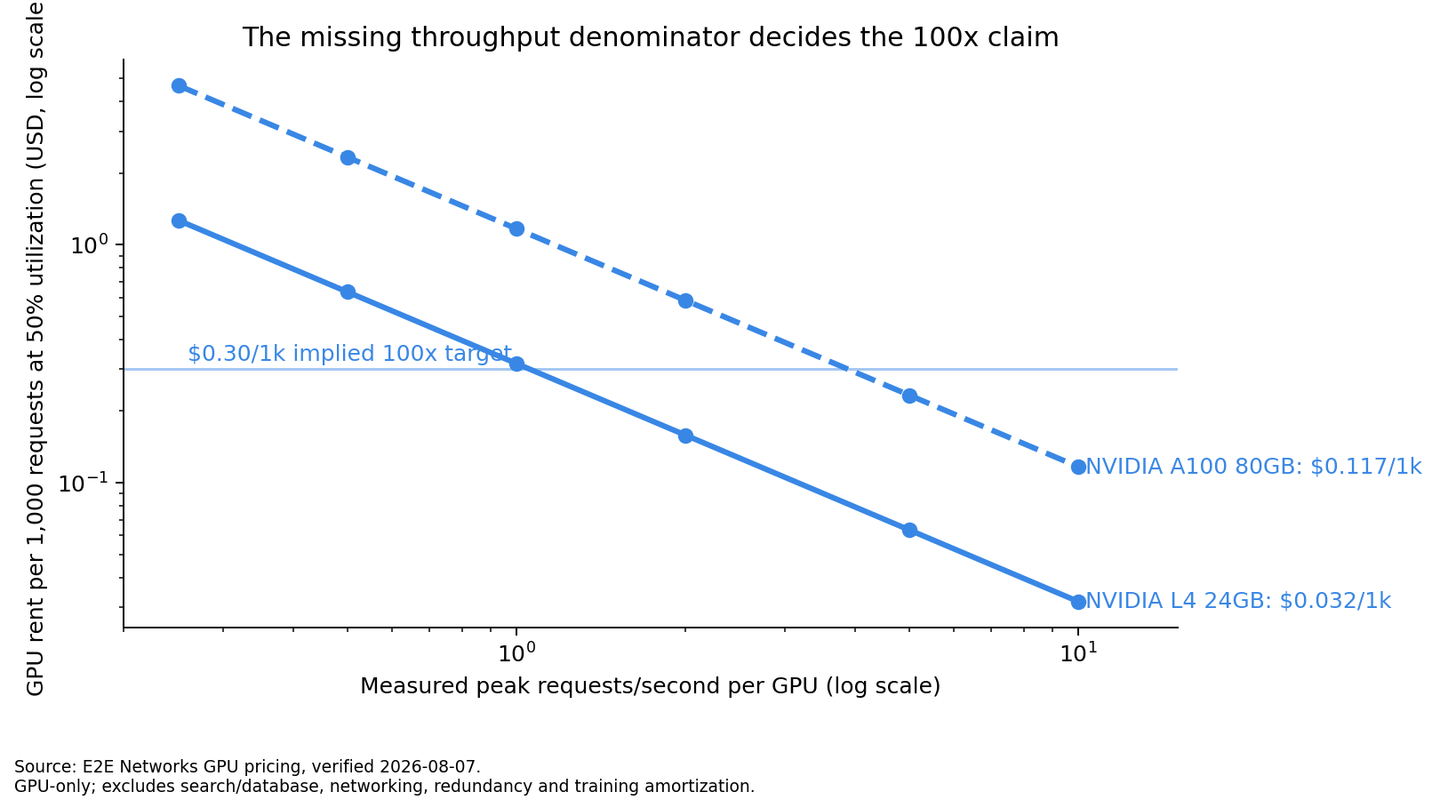
Put your own Sol token shape into the calculator before comparing it with the GPU line. The $0.03 reference is useful only if your request looks like the reference.
The six denominators still missing
The model size is not the cost model. A reproducible 4B result needs six more lines.
- Input and output shape. “Per request” hides the number of search iterations, retrieved tokens, generated tokens, and tool calls.
- Measured production throughput. Peak requests/second must include the full agent loop at the promised tail latency, not isolated token generation.
- Utilization. A benchmark at full load does not price idle periods. The table shows a 4x request-cost swing between 25% and 100% utilization.
- Search and database charges. The workflow queries a retrieval system. GPU rent does not pay that bill.
- Redundancy and operations. A hot spare adds another GPU-hour while it waits. Monitoring, deployment, network, and failure recovery remain separate.
- Training amortization. Agentic RL cost per request equals total post-training cost divided by the lifetime requests that use the resulting checkpoint.
The last denominator matters when the corpus or task changes. A specialized model can beat a general model on a stable, repeated task. Re-training frequency decides whether that saving survives production.
What this means for routing
The result supports the direction, not the headline multiplier. A post-trained 4B model can be an excellent specialist when traffic is steady and the task is narrow. Keep the general model as a fallback for requests outside the trained distribution. That is model routing with a measurable boundary.
Do not route because “4B” sounds cheap. Route after a shadow test records cost per successful retrieval, tail latency, and fallback rate. A cheap first pass that often escalates pays two inference bills. Our confidence-gated cascade analysis prices that double-spend explicitly.
Honest tradeoff: missing public data is not a failed benchmark
Neon and Castform may have internal serving receipts that clear every threshold above. The post's main purpose is to explain training and retrieval quality, not to provide a finance model. Absence of a public denominator does not prove the 100x claim false.
It does change how buyers should use the number. Treat 100x as an invitation to benchmark, not a budget input. Publish the request shape, GPU, quantization, batch size, measured requests/second, utilization, search cost, and training denominator. Then the result becomes portable.
Sources
- Neon and Castform's source article, captured 2026-08-07: about $0.03 for a typical multi-turn GPT-5.6 Sol search and the 100x-cheaper claim for small open-weight models.
- OpenAI API pricing, captured 2026-08-07: GPT-5.6 Sol at $5/1M input and $30/1M output tokens.
- E2E Networks GPU pricing, captured 2026-08-07: NVIDIA L4 24GB at $0.57/hour and A100 80GB at $2.10/hour, excluding taxes.
- Hacker News discussion, captured 2026-08-07: 425 points and 114 comments, the trigger for this same-day audit.
All arithmetic is reproduced in the accompanying script. No Vynaris traffic, customer, or routing data is used.