
Blog · 2026-08-05 · Vynaris Team
Forecast AI agent API cost before building: 3 calls vs 40 is a 53x bill
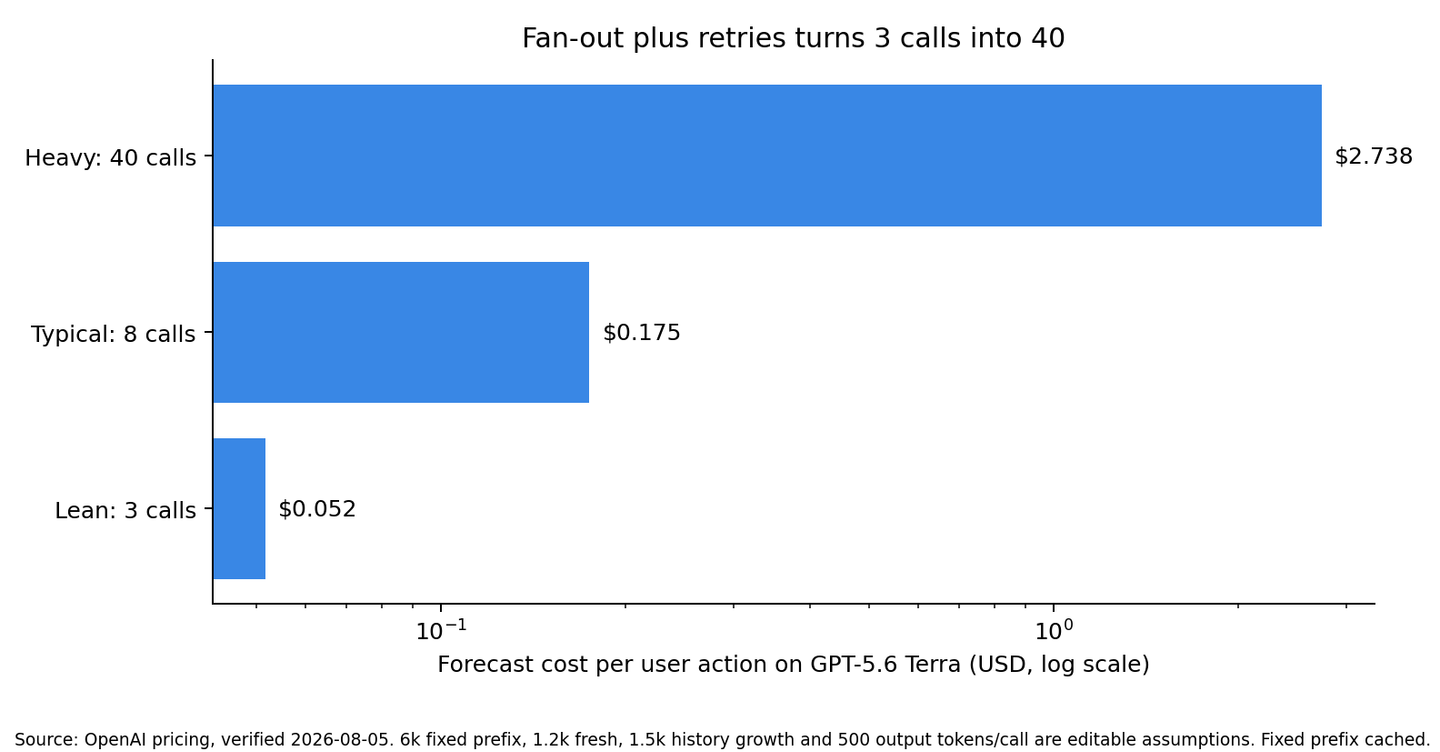
A 40-call agent workflow costs 53.1x a 3-call path on GPT-5.6 Terra after fixed-prefix caching. Editable forecast, prices verified 2026-08-05.
A 40-call agent workflow costs 53.1x a three-call workflow on GPT-5.6 Terra after caching the fixed prefix: $2.7378 versus $0.0516 per user action. Calls grow 13.3x, but accumulated history makes input grow 55.9x. Budget the call graph and context curve before choosing a model. Prices verified 2026-08-05.
TL;DR
- Expected calls equal base workflow calls divided by one minus the retry rate. A three-call lean path, eight-call typical path and 40-call heavy path fall straight out of the shown fan-out assumptions.
- At 40 calls, the workflow sends 1.458M input and 20,000 output tokens. Re-sent history contributes 1.17M input tokens, or 80.2% of the total.
- On GPT-5.6 Terra, fixed-prefix caching cuts the typical eight-call action from $0.2472 to $0.1746. It cuts the heavy action only 13.3%, from $3.1560 to $2.7378, because growing history dominates.
- Across five models, the cached typical action ranges from $0.0093 on deepseek-v4-flash to $0.1746 on Terra. The cached heavy action ranges from $0.1776 to $2.7378.
- A forecast is a range, not one fake precise average. Launch budgets need lean, expected and heavy paths, plus volume.
The verdict table
Model                                                                  Lean: 3 calls  Typical: 8 calls  Heavy: 40 calls
---------------------------------------------------------------------  -------------  ----------------  ---------------
[deepseek-v4-flash](https://vynaris.com/models#deepseek-v4-flash)      $0.00243       $0.00930          $0.17762
[GPT-5.6 Luna](https://vynaris.com/models#gpt-5-6-luna)                $0.00516       $0.01746          $0.27378
[Claude Haiku 4.5](https://vynaris.com/models#claude-haiku-4-5)        $0.02430       $0.08330          $1.34890
[Claude Sonnet 5](https://vynaris.com/models#claude-sonnet-5) (intro)  $0.04860       $0.16660          $2.69780
[GPT-5.6 Terra](https://vynaris.com/models#gpt-5-6-terra)              $0.05160       $0.17460          $2.73780
All rows use prompt caching only on the 6,000-token fixed prefix. The growing conversation stays dynamic. Sonnet 5 uses its now-standard $2/$10 price. Terra is $2/$12. DeepSeek is $0.14/$0.28 with cache hits at $0.0028. Prices are per 1M tokens. Updated 2026-08-14.
Start with the call graph, not the token price
An AI agent is a graph of model calls. A user action may plan, fan out to workers, synthesize results, check the answer and retry failures. The sticker price matters only after that graph is bounded.
We use four base stages:
base calls = 1 planner + N workers + 1 synthesis + 1 check
expected calls = base calls / (1 - retry rate)
The retry term uses the geometric expectation. A 20% retry probability does not add exactly 20% once retried calls can fail again. Dividing by 0.8 captures the expected executions under the same failure probability.
Scenario  Fan-out workers  Retry rate  Base calls  Expected calls
--------  ---------------  ----------  ----------  --------------
Lean      0                0%          3           3
Typical   4                12.5%       7           8
Heavy     29               20%         32          40
The 29-worker heavy path is not a default recommendation. It represents research, browser or multi-agent systems that parallelize broadly and then retry weak branches. If your design cannot explain why 29 branches exist, delete them before pricing them.
This general forecast differs from our coding-agent cost-per-task report. That article prices one fixed eight-call coding trace. Here call count is an output of fan-out and retry assumptions, and the context curve changes with it.
Price the growing context curve
Every call uses four token components.
Component       Assumption         Billing behavior
--------------  -----------------  --------------------------------------------------------
Fixed prefix    6,000 tokens       System prompt, tools and policy; cached after first call
Fresh input     1,200 tokens/call  New tool result or user state
History growth  1,500 tokens/call  Added to the conversation and re-sent later
Output          500 tokens/call    Reasoning, tool arguments and answer text
For n calls, uncached input is:
input(n) = n x (6,000 + 1,200) + 1,500 x n x (n - 1) / 2The final term is triangular. Call two re-sends one growth block. Call three re-sends two. By call n, accumulated history has been billed across many turns. That produces the quadratic context window curve.
Scenario          Input tokens  History part  Output tokens
----------------  ------------  ------------  -------------
Lean, 3 calls     26,100        4,500         1,500
Typical, 8 calls  99,600        42,000        4,000
Heavy, 40 calls   1,458,000     1,170,000     20,000
Calls rise from 3 to 40, or 13.3x. Input rises from 26,100 to 1.458M, or 55.9x. This is the budget failure hidden by a flat “tokens per call” estimate.
The public Expensively Quadratic discussion highlighted the same mechanism around long agent conversations and repeated cache reads. We do not import its cost figures. We show the derivation here using a current price page and editable tokens.
Worked GPT-5.6 Terra forecast
Terra costs $2 per 1M fresh input, $0.20 per 1M cached input, $2.50 per 1M cache writes and $12 per 1M output. For the typical eight-call action:
first 6k prefix write: 6,000 x $2.50 / 1M = $0.0150
seven prefix reads:   42,000 x $0.20 / 1M = $0.0084
dynamic input:        51,600 x $2.00 / 1M = $0.1032
output:                4,000 x $12.00 / 1M = $0.0480
cached total                                  = $0.1746
Without caching, 99,600 input and 4,000 output cost $0.2472. The fixed-prefix cache saves 29.4%.
The heavy path is different:
prefix write + reads = $0.0618
dynamic input        = 1.218M x $2 / 1M = $2.4360
output               = 20k x $12 / 1M  = $0.2400
cached total                                  = $2.7378
Caching saves only 13.3% there. The 1.17M-token history term overwhelms the fixed 6,000-token prefix. “We enabled caching” is not a forecast. It is one line inside the forecast.
Use the cost calculator for the typical uncached shape, then separate fresh, cached and write tokens with the formula above. A blended input number cannot model cache misses.
Cache-hit sensitivity
The table above assumes every eligible fixed-prefix read hits. Real systems mutate timestamps, tool ordering or request metadata and break the prefix.
Fixed-prefix hit rate  Typical Terra  Heavy Terra
---------------------  -------------  -----------
0%                     $0.2502        $3.1590
50%                    $0.2124        $2.9484
80%                    $0.1897        $2.8220
100%                   $0.1746        $2.7378
A 0% hit path is slightly above the plain uncached line because it still pays the first cache-write premium. That is the cache-churn trap: write a prefix, fail to reuse it, and pay extra for the privilege.
Our prompt-cache churn analysis covers that operational failure in detail. For this forecast, keep cache-hit rate as a variable. Do not hardcode 100% because a local test reused one prompt twice.
Turn per-action cost into a budget range
A per-action forecast becomes a monthly budget only after volume. At 100,000 user actions per month:
Model              Lean monthly  Typical monthly  Heavy monthly
-----------------  ------------  ---------------  -------------
deepseek-v4-flash  $243          $930             $17,762
GPT-5.6 Luna       $516          $1,746           $27,378
Claude Haiku 4.5   $2,430        $8,330           $134,890
Claude Sonnet 5    $4,860        $16,660          $269,780
GPT-5.6 Terra      $5,160        $17,460          $273,780
That table is why one point estimate is dishonest. A product manager may budget the typical Terra line at $17,460 and still ship a workflow that lands on the heavy path at $273,780. The model did not become expensive. The graph did.
Pair the forecast with per-call dollar metering after launch. Forecasting sets the envelope. Metering tells you which assumption broke. Then use team spend ceilings to catch the breach before month-end.
What to measure in the prototype
Record these five distributions, not averages:
- Calls per user action, split by planner, worker, synthesis and checker.
- Retry count and the failure reason that triggered each retry.
- Fresh, cached-read, cache-write and reasoning tokens per call.
- Context length by turn, so the triangular history term is visible.
- Cost per completed outcome, including failed actions that produced no result.
LLM cost attribution should reconcile every call back to one user action. If shared planner or judge calls serve several actions, allocate them across those consumers. An orphaned shared call makes the forecast look better without changing the invoice.
Use p50, p90 and p99 for calls and tokens. Finance needs the expected line. Reliability needs the tail. One runaway at p99 can set rate-limit and gross-margin requirements even when median cost looks harmless. For the empirical version of that lesson on SWE-bench runs, see our coding-agent token-cost prediction audit: same-task spreads up to 30x and self-estimates that top out at 0.39 correlation.
Turn each assumption into a stop condition
A forecast becomes useful when every variable has an owner and a limit. The planner owns fan-out. Tool wrappers own response size. The orchestrator owns retries. Prompt construction owns cache stability. Product owns monthly action volume.
Write those limits into the design before launch. A worker should stop when it has enough evidence. A retry should require a named failure code. Tool output should be truncated or summarized before it joins history. Cache-breaking metadata should sit after the reusable prefix. An action should fail closed when its call ceiling is reached.
This turns the spreadsheet into control logic. If a prototype crosses the typical call count, the trace shows which branch caused it. If heavy-path cost is unacceptable, you can reject that architecture before optimizing prompts. The forecast is doing its job when it changes the graph, not when it predicts an invoice with theatrical precision.
What it means for routing
Model routing comes after graph control. A heavy DeepSeek action costs $0.1776, slightly above a typical Terra action at $0.1746. Forty cheap calls can erase the entire sticker advantage over eight stronger calls.
Route only steps with different quality needs. Keep planning or final review on the stronger model. Put deterministic transforms and bounded extraction on the cheaper model. More importantly, stop branches when they have enough evidence. Saving one unnecessary worker prevents its call, its output and every future turn that would re-send that output.
The strongest cost optimization can be fewer calls, not a cheaper model. The route-the-plumbing analysis shows the per-step version. This forecast shows why architecture decides the ceiling before routing trims the floor.
Honest tradeoff: pre-build forecasts are intentionally wrong
No pre-build model knows your retry rate, tool output size or cache-hit rate. The purpose is not invoice accuracy to the cent. It is to expose which assumptions can move cost by 10x before code makes them invisible.
Over-modeling is its own waste. If the feature has ten users, build the lean path, cap calls and meter it. Do not spend a week estimating p99. If the feature can reach 100,000 monthly actions or includes open-ended research loops, the heavy-path table is essential.
Quality can also invert the table. A stronger planner that removes half the worker branches may cost less per completed outcome than a cheap planner that fans out and retries. Measure completed outcomes, not successful HTTP responses.
Caveats
- Token counts are assumptions. Tool results can be 100 tokens or 100,000.
- Retry probability is treated as stable across repeated attempts. Real failures can be correlated.
- Only the fixed prefix caches. Providers may also cache growing prefixes, but TTLs and mutation patterns decide whether that works.
- We exclude web-search fees, browser compute, vector storage and human review. Those need separate lines.
- Anthropic canceled Sonnet 5's scheduled 2026-09-01 increase. The same token shape remains at $2/$10.
- DeepSeek has announced future peak pricing, but no effective date is live. We use the current regular rate.
Sources
- OpenAI API pricing, captured 2026-08-05: GPT-5.6 Luna $0.20/$1.20 and Terra $2/$12; cache reads at 0.1x and writes at 1.25x.
- Anthropic API pricing, re-verified 2026-08-14: Haiku 4.5 $1/$5; Sonnet 5 $2/$10 standard; cache read/write rates.
- DeepSeek API pricing, captured 2026-08-05: deepseek-v4-flash $0.14 cache miss, $0.0028 cache hit and $0.28 output.
- Expensively Quadratic: The LLM Agent Cost Curve, captured 2026-08-05: public discussion of growing-context agent costs; 131 points and 81 comments.
All call counts, token counts, fan-out and retry rates are shown derivations or editable assumptions. Replace them before committing budget.