
Blog · · Updated · By Dhrumil Barot, Founder
Set per-team token budget ceilings that catch a runaway before month-end
A per-team spend ceiling is four pieces of arithmetic: per-call cost to monthly spend, growth projection, headroom ceiling, and a pace alert that trips mid-month. The team you cap first is rarely the one spending most today.
A per-team spend ceiling is four pieces of arithmetic: turn an accurate per-call cost into this month's spend, project next month with a growth rate, add headroom to get a ceiling, then compare running spend against a straight-line pace so a breach trips mid-month, not on the invoice. This how-to builds all four on a real four-team workload, every per-call cost derived from a token shape at prices verified 2026-07-22. The catch nobody mentions: the team you cap first is almost never the one spending the most today.
The per-call number is the input, not the subject. Get it right first with a dollars-per-call metering recipe that reads your usage object and prices reasoning and cache tokens correctly. This post starts one layer up, where finance actually lives: you already know each call's cost and you need a ceiling per team that a dashboard can enforce.
Verdict: the four steps and what each one is for
| Step | Formula | What it answers |
|---|---|---|
| 1. This-month spend | per-call cost x calls/day x 30 | What is each team actually costing right now? |
| 2. Next-month projection | spend x (1 + MoM growth) | Where does the trend land it next month? |
| 3. Ceiling | projection x (1 + headroom) | What number does a hard cap sit at? |
| 4. Pace alert | spend_so_far x 30 / day_d vs ceiling | Will it breach, and how many days of warning do I get? |
Steps 1 and 2 rank the teams. Step 3 sets the enforceable number. Step 4 is the one that saves you: it fires on the trajectory, weeks before the total lands.
The workload
Four teams, four models, four different token shapes. Each per-call cost is computed from its input/output token counts at list prices read live 2026-07-22, so every dollar traces back to a rate you can check.
| Team | Model | Tokens (in / out) | Calls/day | Per-call | MoM growth |
|---|---|---|---|---|---|
| Support bot | Haiku 4.5 | 3,000 / 400 | 8,000 | $0.00500 | +5% |
| Coding agent | Gemini 3.6 Flash | 20,000 / 8,000 | 400 | $0.09000 | +45% |
| Classifier | Gemini 3.5 Flash-Lite | 2,000 / 100 | 50,000 | $0.00085 | +8% |
| Doc summarizer | GPT-5.6 Luna | 12,000 / 600 | 2,000 | $0.01560 | +10% |
The per-call cost is the metering layer's output. If you have not built that yet, the Coding agent number is a good example of why it matters: an output-heavy loop on Gemini 3.6 Flash costs 18x a Support-bot call, so a single hardcoded average would misprice the whole forecast.
Step 1: per-call cost becomes this month's spend
Multiply the per-call cost by daily volume and 30 days. No modeling, just a run-rate.
Support bot     $0.00500/call x  8,000/day x 30 = $1,200.00/mo
Coding agent    $0.09000/call x    400/day x 30 = $1,080.00/mo
Classifier      $0.00085/call x 50,000/day x 30 = $1,275.00/mo
Doc summarizer  $0.01560/call x  2,000/day x 30 =   $936.00/mo
                                          TOTAL = $4,491.00/mo
The Classifier is the biggest line at $1,275 a month, and it does it at 850 millionths of a dollar per call. High-volume-cheap outspends low-volume-expensive when the volume gap is wide enough. That is the first reason level alone is a bad cap signal.
Step 2: project next month with a growth rate
A ceiling built on last month invites a breach the moment traffic climbs. Multiply each spend by one plus its month-over-month growth. Use your own observed rate per team, not a single blended number, because that spread is the whole point.
Support bot     $1,200.00 x (1 + 5%)  = $1,260.00/mo
Coding agent    $1,080.00 x (1 + 45%) = $1,566.00/mo
Classifier      $1,275.00 x (1 + 8%)  = $1,377.00/mo
Doc summarizer    $936.00 x (1 + 10%) = $1,029.60/mo
                                TOTAL = $5,232.60/mo
The ranking just flipped. The Coding agent was fourth by current spend and is now first by projection, because 45% month-over-month swamps a $195 head start. This is the number a ceiling should be built on.
Step 3: ceiling equals projection plus headroom
The projection is a point estimate; real traffic is lumpy. Add a headroom band so a normal spike does not page anyone. Twenty percent is a reasonable default; widen it for bursty teams, tighten it for steady ones.
ceiling = projection x (1 + 0.20 headroom)

Support bot     $1,260.00 x 1.20 = $1,512.00/mo
Coding agent    $1,566.00 x 1.20 = $1,879.20/mo
Classifier      $1,377.00 x 1.20 = $1,652.40/mo
Doc summarizer  $1,029.60 x 1.20 = $1,235.52/mo
That is the enforceable number: the value your dashboard alerts on and, if you enforce hard, the point where the gateway starts rejecting calls. Headroom is a policy dial, not a law of nature, so write down why you picked it.
Step 4: the pace alert that fires mid-month
A ceiling you only check at month-end is a smoke detector you read after the fire. The fix is to project the end-of-month total from the run so far and compare that against the ceiling every day.
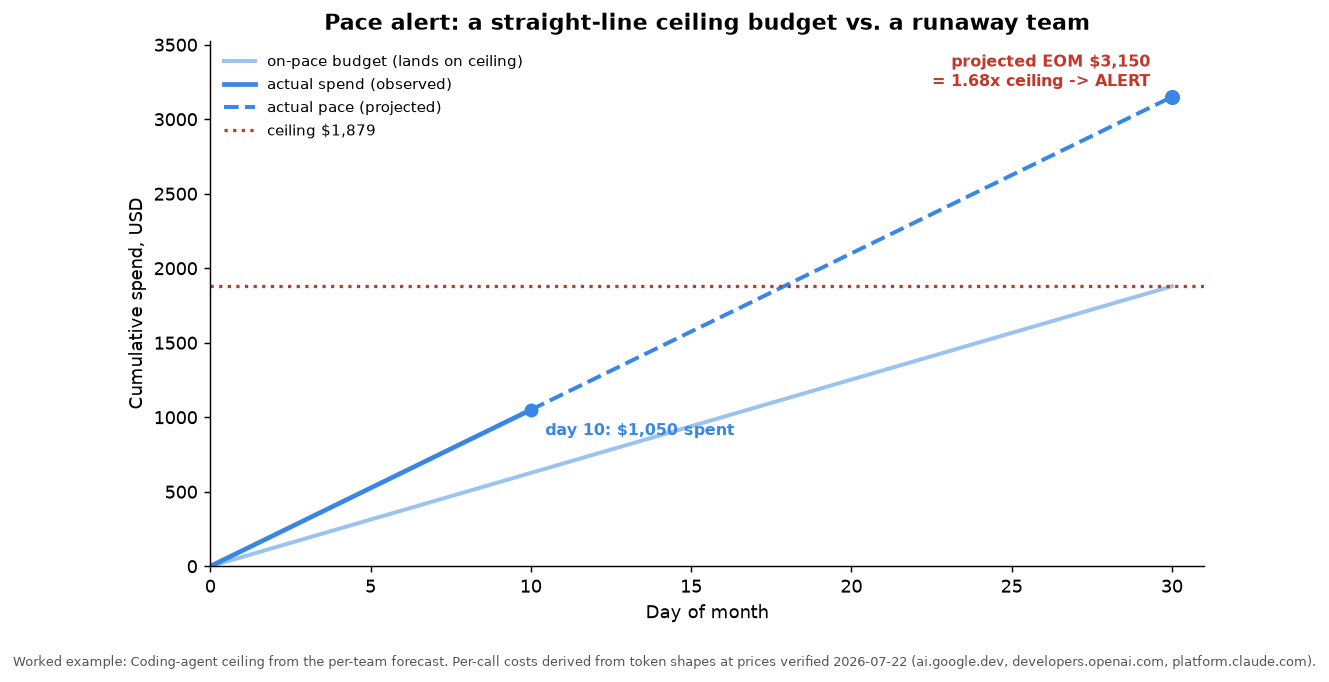
Take the Coding agent, ceiling $1,879.20. Suppose by day 10 it has spent $1,050.
on-pace budget by day 10 = ceiling x 10/30      = $626.40
projected end-of-month    = $1,050 x 30/10       = $3,150.00
breach? $3,150 > $1,879.20 ceiling               -> ALERT
Ten days in, it has already burned $1,050 against a $626 on-pace allowance, and its trajectory lands at $3,150, or 1.68x the ceiling. You get 20 days of warning instead of a surprise on the statement.
To make this one threshold across every team, normalize it into a pace ratio and alert above a margin:
pace ratio = (spend_so_far / ceiling) / (day_d / 30)
           = ($1,050 / $1,879.20) / (10 / 30)
           = 1.68        # alert when ratio > 1.10
A ratio of 1.0 means exactly on pace to hit the ceiling on day 30. The 1.10 margin absorbs early-month noise so a slow Monday does not page anyone. One rule, every team, no per-team thresholds to maintain.
Who to cap first: growth, not level
Rank by next-month projection, and check the two-months-out figure to see which team runs away if left alone.
1. Coding agent    proj $1,566.00 (29.9% of next bill), +45%, in 2 months $2,270.70
2. Classifier      proj $1,377.00 (26.3% of next bill),  +8%, in 2 months $1,487.16
3. Support bot     proj $1,260.00 (24.1% of next bill),  +5%, in 2 months $1,323.00
4. Doc summarizer  proj $1,029.60 (19.7% of next bill), +10%, in 2 months $1,132.56
Cap the Coding agent first. It is only 24.0% of this month's bill but 29.9% of next month's, and left uncapped for two months it reaches $2,271, more than any other team. The Classifier is the biggest line today and the correct answer is still to leave its ceiling generous and watch the Coding agent, because a 45% grower crosses a fixed cap on a schedule you can read off a calendar. Level tells you who is expensive; growth tells you who is about to be.
The honest tradeoff: this forecast breaks on a step change
Everything above assumes smooth month-over-month growth. It is a straight-line extrapolation, and it is wrong precisely when spend is least smooth: a viral launch, a new enterprise customer switched on overnight, a retry loop that quietly 10x's call volume in an afternoon. On those days the pace ratio spikes far past 1.10 in hours, which is a feature if your alert runs daily and a liability if you only recompute the ceiling monthly. Two guardrails: recompute the pace ratio at least daily so a step change surfaces the same day, and keep a hard per-call ceiling from the metering layer underneath, because a per-team monthly cap does nothing to stop one pathological call from costing $50. The reserve-before-dispatch pattern shows how to enforce that ceiling across concurrent workers. The forecast governs the trend; the transactional hold governs the next liability. You need both.
What to actually do this week
- Pull last month's per-team spend from your metering data, not a blended average, so each team carries its own per-call cost.
- Compute each team's month-over-month growth from the last two or three months and project forward; do not reuse one blended rate.
- Set ceilings at projection x 1.2, then widen headroom for bursty teams and tighten it for steady ones.
- Wire the pace ratio into your daily cost job and alert above 1.10; that single rule covers every team.
- Re-price the whole table whenever a provider moves rates, and treat routing a new tier as a deliberate right-sizing decision rather than letting a client library pick the newest string. The July 2026 Gemini Flash refresh moved two rates in opposite directions on one page, which shifts every ceiling built on them.
To sanity-check any single team's per-call cost before you forecast it, run its token shape through the calculator; for the full cross-provider rate sheet behind every model named here, see the July 2026 LLM price list.
FAQ
How is a per-team ceiling different from per-call metering? Metering reconstructs the exact dollar cost of one call from its usage object; it is the input. A ceiling is the org layer on top: it forecasts a monthly cap per team, adds headroom, and alerts on pace. Build the meter first, then this.
Why cap by growth instead of current spend? A fixed ceiling is crossed by whichever team's trajectory is steepest, not whichever is largest today. In the worked example the biggest current spender (Classifier, +8%) is not the cap-first team; the fastest grower (Coding agent, +45%) is, because it overtakes everything within two months.
What headroom should I use? Twenty percent is a sane default. Widen it for teams with lumpy, bursty traffic so normal spikes do not page anyone; tighten it for steady, predictable teams where a small overshoot is a real signal. It is a policy dial, so document your choice.
Why does the pace alert use a ratio? The ratio (spend/ceiling)/(day/30) normalizes every team to one threshold: 1.0 is exactly on pace to hit the ceiling on day 30, and a 1.10 margin absorbs early-month noise. One rule scales to any number of teams without per-team thresholds.
Do the prices here match my bill? The rates were verified live 2026-07-22, but your per-call cost depends on your own token shapes, cache hit rate, and reasoning-token usage. Derive your numbers from your metering data before setting ceilings; the shapes here are illustrative.
Sources
- Google Gemini API pricing (Gemini 3.6 Flash $1.50/$7.50, 3.5 Flash-Lite $0.30/$2.50), verified 2026-07-22: https://ai.google.dev/gemini-api/docs/pricing
- OpenAI API pricing (GPT-5.6 Luna $1/$6), verified 2026-07-22: https://developers.openai.com/api/docs/pricing
- Anthropic pricing (Haiku 4.5 $1/$5), verified 2026-07-22: https://platform.claude.com/docs/en/docs/about-claude/pricing
- All arithmetic:
token-spend-caps-per-team-budget-math-howto-math.py, team shapes and growth rates editable inline.
Related: dollars-per-call metering recipe · July 2026 LLM price list · Gemini Flash refresh re-route math