
Blog · · By Dhrumil Barot, Founder
LLM Expenditure Fell 12.1% Without a List-Price Cut: the Market-Mix Math
Proprietary LLM expenditure fell 12.1% without a matching list-price cut. See the $1.0018-to-$0.9861 market-mix math.
Proprietary LLM expenditure fell 12.1% in seven days while the provider sheets we could verify showed no corresponding list-price cut. The broad SDLLMTK series fell only 1.57%, from $1.0018 to $0.9861 per million blended tokens. The gap is market mix, not a cheaper universal price card. Prices verified 2026-09-07.
TL;DR
- Silicon Data's proprietary segment ended at $1.98 per million tokens, down 12.1% in seven days. Its open-model segment ended at $0.53, up 2.3%.
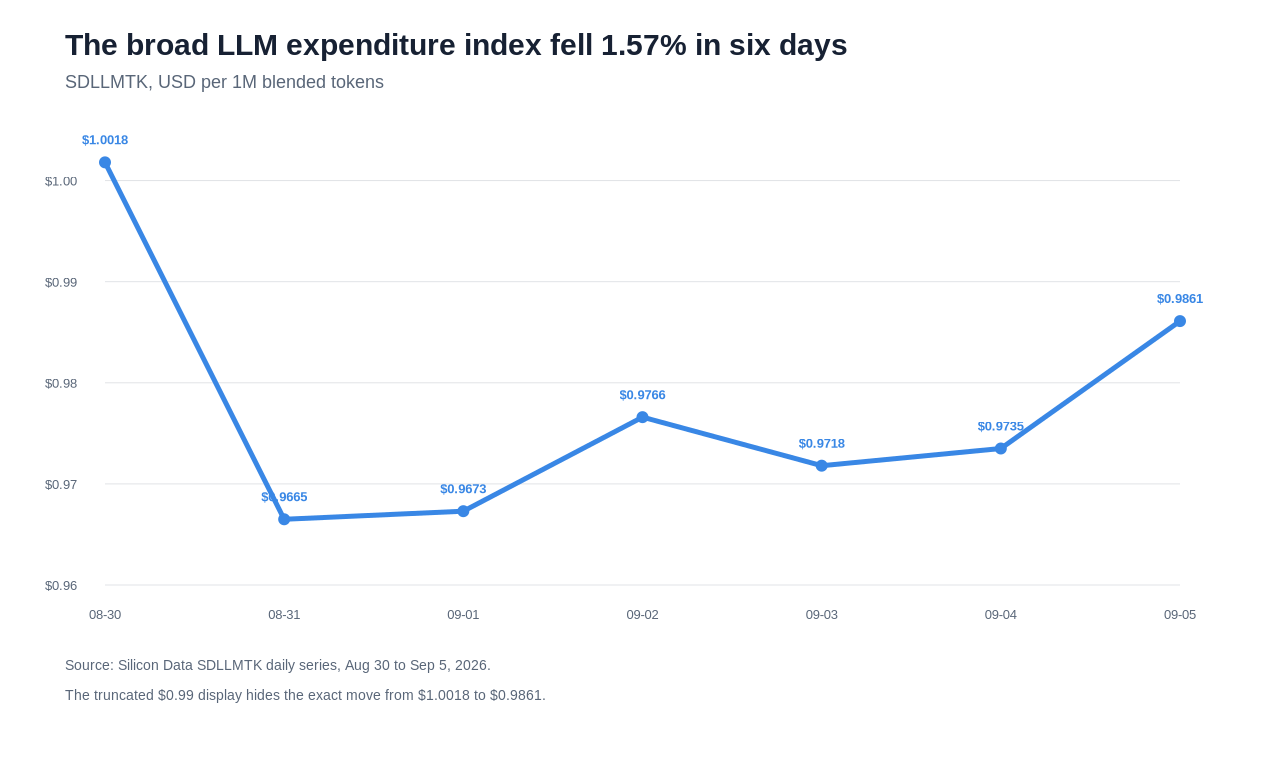
- The broad daily series moved from $1.0018 on 2026-08-30 to $0.9861 on 2026-09-05. That is a $0.0157 drop, or 1.57%.
- At that broad reference rate, 10,000 blended tokens moved from $0.010018 to $0.009861. One billion moved from $1,001.80 to $986.10.
- A weighted index can fall with every component price fixed. Our two-model example drops 38.71% when usage shifts from a $2.00 model to a $0.50 model.
Verdict table
| Question | Public reading | What it means | What it does not mean |
|---|---|---|---|
| Broad LLM expenditure | $0.9861/1M, down 1.57% from Aug 30 | The observed market paid slightly less per blended million tokens | Every provider cut prices 1.57% |
| Proprietary segment | $1.98/1M, down 12.1% in 7D | Closed-model usage, token shape, or basket composition got cheaper | A named proprietary model became 12.1% cheaper |
| Open segment | $0.53/1M, up 2.3% in 7D | The open-model basket moved the other way | Open-model list prices rose 2.3% |
| Provider sheets | No corresponding cut in extractable tracked rows | Mix can explain movement without repricing | Every historical row on every provider was unchanged |
| Your invoice | Unknown from the index | Measure your models, tokens, cache events, and tools | Multiply every token by $0.9861 |
The decisive distinction is between a rate card and an expenditure benchmark. Token-based pricing tells you what a named meter costs. A usage-weighted index tells you where paid activity landed across many meters.
What moved, exactly
The Silicon Data LLM Token Expenditure Index publishes three views. The broad benchmark covers the observable active market. Separate views cover open and proprietary models.
The broad series is available at four decimal places in the linked portal chart:
| Date | SDLLMTK, USD/1M | Day-over-day move |
|---|---|---|
| 2026-08-30 | $1.0018 | Starting point |
| 2026-08-31 | $0.9665 | -3.52% |
| 2026-09-01 | $0.9673 | +0.08% |
| 2026-09-02 | $0.9766 | +0.96% |
| 2026-09-03 | $0.9718 | -0.49% |
| 2026-09-04 | $0.9735 | +0.17% |
| 2026-09-05 | $0.9861 | +1.29% |
The series first fell sharply, then recovered most of the loss. Comparing only the endpoints gives:
($0.9861 / $1.0018 - 1) × 100 = -1.57%
The site's rounded card displays $0.99 and a 1.6% downward move. Neither number says a provider cut a list price.
The segment numbers do not describe one model
Silicon Data says each series combines provider pricing with observed consumption volume. It normalizes observations for input tokens, output tokens, and context window. It then filters for sustained usage and market expenditure.
The proprietary card ended at $1.98 after a 12.1% seven-day fall. Because the card rounds both fields, we can only recover an approximate starting level:
$1.98 / (1 - 0.121) = about $2.2526 per million tokens
The open card ended at $0.53 after a 2.3% rise:
$0.53 / (1 + 0.023) = about $0.5181 per million tokens
Those reconstructed starts are not hidden source values. They are arithmetic from rounded cards. Do not combine them to reverse-engineer the broad benchmark. Silicon Data does not publish enough weights or basket details for that reconstruction.
Editable market-mix assumptions and the exact mechanism
Let w(i,t) be model i's expenditure weight at time t. Let p(i,t) be its normalized effective price. The index is:
E(t) = sum of w(i,t) × p(i,t)
An exact two-period decomposition is:
E(1) - E(0) = sum of w(i,0) × [p(i,1) - p(i,0)] + sum of [w(i,1) - w(i,0)] × p(i,1)
The first term captures pricing and within-model token-shape changes. The second captures changing weights. Basket additions and removals sit inside the same composition problem.
Now hold two list prices fixed. Model A costs $2.00 per million tokens. Model B costs $0.50. Move the usage mix from 70% A to 30% A.
| Period | Model A weight | Model B weight | Both prices fixed | Weighted expenditure |
|---|---|---|---|---|
| Start | 70% | 30% | $2.00 / $0.50 | $1.55/1M |
| End | 30% | 70% | $2.00 / $0.50 | $0.95/1M |
The calculation is simple:
Start = 0.70 × $2.00 + 0.30 × $0.50 = $1.55
End = 0.30 × $2.00 + 0.70 × $0.50 = $0.95
Change = ($0.95 / $1.55 - 1) × 100 = -38.71%
No model got cheaper. Buyers simply purchased more of the cheaper model. Model routing, product adoption, and workload seasonality can all change those weights.
What we verified on provider sheets
We fetched the tracked OpenAI pricing, Anthropic pricing, Google Gemini pricing, and DeepSeek pricing pages on 2026-09-07.
The extractable OpenAI rows still listed GPT-6 Astra at $10 input and $50 output per million. GPT-5.6 Sol remained at its $4/$20 promotional rate. Anthropic still listed Claude Fable 5.1 at $10/$50 and Claude Opus 5 at $5/$25. Google still listed Gemini 3.8 Flash at $0.75/$3.75 through 2026-12-31.
DeepSeek's page returned HTTP 200 and named its current V4 families. Its numeric table remained client-rendered in our static fetch. We therefore exclude DeepSeek from any exact unchanged-rate claim. A green HTTP status is not a price receipt.
This check supports a narrow conclusion. We found no corresponding cut in the provider rows we could read. It does not prove that no model anywhere changed price.
Translating the index into task economics
The broad benchmark is quoted per million blended tokens. For a reference task containing 10,000 blended tokens, the endpoint math is:
2026-08-30: 10,000 / 1,000,000 × $1.0018 = $0.010018 per task
2026-09-05: 10,000 / 1,000,000 × $0.9861 = $0.009861 per task
At one billion blended tokens, the same reference moves from $1,001.80 to $986.10. The difference is $15.70.
That is a benchmark translation, not a forecast for your stack. Your cost per task depends on chosen models and token types. Prompt caching, long-context uplifts, retries, tools, and batch tiers can swamp a 1.57% market move.
Use the LLM cost calculator with your actual rates and token counts. Our August API pricing table provides a dated rate-card comparison. The post-Luna router rerate shows how a real provider cut changes routing break-even volume.
What this means for routing
Do not auto-route from the index level. Use it as a market baseline and an investigation trigger.
If your blended invoice falls while call volume stays flat, decompose the movement. Check model share, input/output ratio, cache-read share, and accepted outcomes. A cheaper mix can hide falling quality or more retries. An expensive mix can reflect more difficult work.
Procurement teams can compare their movement with the market. Platform teams should still optimize cost per accepted outcome. An LLM gateway can expose the needed dimensions, but the accounting must preserve them.
Honest tradeoff: market truth is not account truth
The index is more useful than a static catalog because it weights economic activity. That strength also limits direct use. Silicon Data does not disclose raw private usage, customer weights, or enough basket detail to reproduce the index independently.
Do not use a 12.1% proprietary-segment decline to demand a 12.1% vendor discount. It is not evidence of that price cut. Use it to ask whether your own model mix is moving toward cheaper accepted outcomes.
FAQ
Did proprietary LLM API prices fall 12.1%?
Not as a universal list-price claim. Silicon Data's proprietary expenditure segment fell 12.1%. Usage mix, token mix, and basket composition can move that measure without a named provider changing its price card.
Why did the broad index fall only 1.57%?
The broad benchmark covers a different universe and weighting scheme from the proprietary card. Open-model expenditure also rose 2.3%. Silicon Data does not publish enough weights to derive one series from the other.
Can we multiply our token count by $0.9861?
Only for a rough market-reference comparison. An invoice requires each model's input, cache, output, tool, and tier rates.
What would prove a provider price cut?
A dated provider price sheet or announcement showing the old and new rates for a named model and service tier. An expenditure-index move alone does not prove it.
When does this analysis not need a router?
When one model clears the quality bar and the saving from switching is smaller than migration and operating cost. Measure first. Route only when the accepted-outcome economics justify it.
Sources
- Silicon Data LLM Token Expenditure Index, methodology, segment cards, and linked daily chart; fetched 2026-09-07.
- OpenAI API pricing; fetched 2026-09-07.
- Anthropic API pricing; fetched 2026-09-07.
- Google Gemini API pricing; fetched 2026-09-07.
- DeepSeek API pricing page; fetched 2026-09-07, with the static-table limitation disclosed above.
All calculations are reproducible in artifacts/llm-token-expenditure-index-market-mix-vs-list-price-math.py. Source snapshots and hashes are archived beside it.