
Blog · · By Dhrumil Barot, Founder
A 50+ turn Hermes session: Kimi K3 $4.56 vs Claude Fable 5 $27.04
OpenRouter’s 50+ turn Hermes median is $4.56 on Kimi K3, $4.79 on Claude Sonnet 5, and $27.04 on Claude Fable 5. What the sticker misses.
At 50+ turns, a paid Hermes Agent session has a $4.56 median on Kimi K3, $4.79 on Claude Sonnet 5, and $27.04 on Claude Fable 5. Kimi is 83.1361% below Fable and 4.8017% below Sonnet. These are observed medians, not controlled or quality-matched tasks.
Prices verified 2026-08-30.
TL;DR
- OpenRouter’s public Hermes chart reports Kimi at $0.054, $0.17, $0.83, and $4.56 across the 1, 2-9, 10-49, and 50+ turn bands. Sonnet is $0.066, $0.14, $0.79, and $4.79. Fable is $0.37, $0.93, $4.38, and $27.04.
- Sticker price does not predict the Kimi-versus-Sonnet order. Kimi costs 50% more per 1M input and output tokens on OpenRouter, yet its observed median is cheaper in the 1-turn and 50+ bands.
- Session length changes the buying unit. The 50+ median is 84.4444× Kimi’s 1-turn median, 72.5758× Sonnet’s, and 73.0811× Fable’s.
- Do not call Kimi “better value” from this table. OpenRouter does not publish matched prompts, token counts, cache use, success rates, or quality for these cells.
Verdict table
| Turn band | Kimi K3 median | Claude Sonnet 5 median | Claude Fable 5 median | Cost verdict |
|---|---|---|---|---|
| 1 turn | $0.054 | $0.066 | $0.37 | Kimi is 18.1818% below Sonnet and 85.4054% below Fable |
| 2-9 turns | $0.17 | $0.14 | $0.93 | Sonnet is 17.6471% below Kimi; Kimi is 81.7204% below Fable |
| 10-49 turns | $0.83 | $0.79 | $4.38 | Sonnet is 4.8193% below Kimi; Kimi is 81.0502% below Fable |
| 50+ turns | $4.56 | $4.79 | $27.04 | Kimi is 4.8017% below Sonnet and 83.1361% below Fable |
The useful buyer threshold is the band change, not a universal crossover. Sonnet has the lower observed median from 2 through 49 turns. Kimi is lower at 1 turn and 50+ turns. Because each cell contains different real sessions, that reversal is a reason to inspect workload composition, not proof that one model becomes more efficient after turn 50.
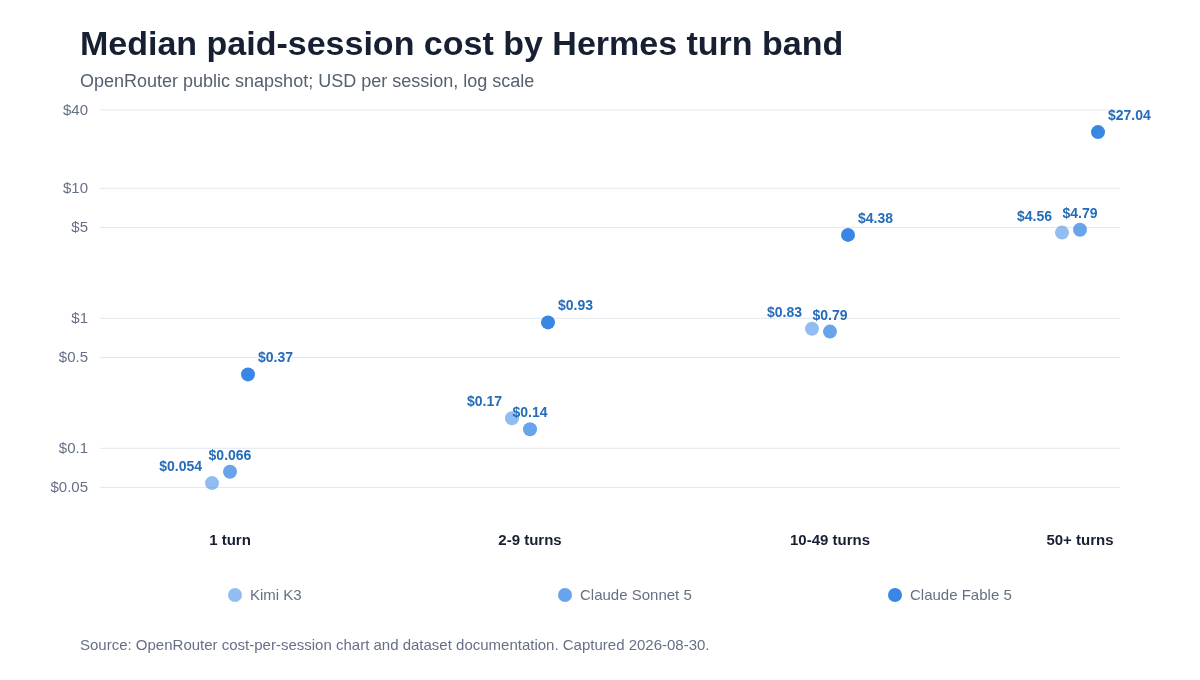
What OpenRouter measured
OpenRouter calls this metric cost per session. Its documentation defines each cell as the median USD spend of paid sessions for one harness, model, and inclusive turn range. Results refresh weekly. Sessions are never pooled across apps, and individual session rows are not exposed.
That makes the dataset more useful than a pure input token cost table. A session includes the work a harness actually sent through the model. Long jobs can carry repeated history, tool results, retries, and reasoning tokens. The bill absorbs all of them.
It also makes the table less controlled than a benchmark. We do not know whether the Kimi, Sonnet, and Fable sessions attempted the same jobs. We cannot see their input/output split, context window use, cache hits, retries, or accepted results. The correct question is “what did a session in this observed bucket cost?” It is not “which model solves the same task cheapest?”
The public inputs
| Input | Kimi K3 | Claude Sonnet 5 | Claude Fable 5 |
|---|---|---|---|
| OpenRouter model ID | moonshotai/kimi-k3 | anthropic/claude-sonnet-5 | anthropic/claude-fable-5 |
| Input price / 1M tokens | $3 | $2 | $10 |
| Output price / 1M tokens | $15 | $10 | $50 |
| 1-turn median session | $0.054 | $0.066 | $0.37 |
| 2-9-turn median session | $0.17 | $0.14 | $0.93 |
| 10-49-turn median session | $0.83 | $0.79 | $4.38 |
| 50+-turn median session | $4.56 | $4.79 | $27.04 |
The rate rows come from OpenRouter’s live model catalog. The session rows come from its public Hermes chart. We did not convert the medians back into tokens because many token shapes can produce the same dollar bill.
For example, one dollar can represent different mixtures of input, cached input, and output. Fable’s input rate is five times Sonnet’s, and its output rate is also five times Sonnet’s. Matched uncached token traces would therefore cost exactly five times as much. The observed Fable-to-Sonnet ratio ranges from 5.5443× to 6.6429× in three bands and is 5.6061× at one turn. Different traces or discounts must be present, but this aggregate table cannot identify them.
Why sticker price loses the Kimi-versus-Sonnet decision
Kimi’s $3/$15 rate is exactly 1.5× Sonnet’s $2/$10 rate. If their session token traces matched, Kimi would cost 50% more in every band.
The observed ratios do not do that:
| Turn band | Kimi / Sonnet observed cost | What the sticker predicts under matched tokens |
|---|---|---|
| 1 turn | 0.8182× | 1.5000× |
| 2-9 turns | 1.2143× | 1.5000× |
| 10-49 turns | 1.0506× | 1.5000× |
| 50+ turns | 0.9520× | 1.5000× |
This gap is the article’s finding. A $/1M comparison answers how two identical token ledgers would price. The session dataset shows that real ledgers are not identical.
Several mechanisms could create the gap. A model may finish with fewer turns. Its prompts may be shorter. Users may assign different jobs to it. Cache rates may differ. Failed runs may end early. None is proven by the aggregate chart, so we do not allocate the gap among them.
Our earlier 30× coding-agent token variance audit reached the same operational conclusion from public research: agent architecture and trajectory can dominate the model sticker. The new OpenRouter table adds a directly observed dollar denominator by harness and turn band.
What 1,000 sessions would put on the invoice
Multiplying a median by volume is a scenario, not a forecast of the mean. Medians do not add into an invoice, and the underlying distribution is unpublished. Still, the multiplication makes the unit legible.
| Turn band | 1,000 × Kimi median | 1,000 × Sonnet median | 1,000 × Fable median |
|---|---|---|---|
| 1 turn | $54 | $66 | $370 |
| 2-9 turns | $170 | $140 | $930 |
| 10-49 turns | $830 | $790 | $4,380 |
| 50+ turns | $4,560 | $4,790 | $27,040 |
At 1,000 50+ sessions, the median-unit gap is $27,040 - $4,560 = $22,480 between Fable and Kimi. Between Sonnet and Kimi it is only $4,790 - $4,560 = $230.
That $230 gap is too small to decide a model without an outcome receipt. One additional failed session in a costly workflow could erase it. The $22,480 Fable gap demands a stronger quality or reliability case, but the chart does not tell us whether that case exists.
Put a measured token shape into the LLM cost calculator. The chart gives the observed session denominator. The calculator gives the controlled token scenario. A production decision needs both.
What this means for routing
Model routing should use the expected cost of an accepted outcome, not the cheapest session cell. That requires three extra measurements.
- Record total input, cached input, output token cost, and retries by session.
- Separate the 1, 2-9, 10-49, and 50+ turn bands before comparing models.
- Attach a task result: accepted patch, resolved ticket, passed test, or human approval.
Then calculate accepted_outcome_cost = total_session_dollars / accepted_outcomes for each workload class. A routing rule earns its keep only when that denominator falls without an unacceptable quality loss.
The per-call dollar metering guide shows how to carry provider cost into each response. Pair that with prompt caching metrics and session IDs. You can then explain whether a long session is expensive because of turn count, repeated context, output, retries, or cache misses.
Honest tradeoff: the expensive session may win
Do not route a high-stakes coding job to Kimi merely because its 50+ median is $22.48 below Fable. If Fable avoids a regression, closes a task in fewer human review cycles, or succeeds where the cheaper model fails, $27.04 can be the lower outcome cost.
The reverse also matters. Do not pay for Fable because “frontier” sounds safer. The chart exposes a 5.9298× observed session-cost multiple at 50+ turns. That premium needs a measured outcome advantage in your own task class.
A simple system can also beat a router. If one model already clears the quality bar and the expected saving is $0.23 per long session, routing logic, eval maintenance, and failure handling may cost more than they return.
Caveats
These are medians, not averages. Multiplying them by session count does not reproduce a provider invoice. OpenRouter’s public view does not expose sample sizes, percentile spreads, token traces, cache-hit rates, or quality scores for the cells shown.
Turn bands are coarse. A 50-turn session and a 500-turn session share the 50+ bucket. Cost does not increase linearly with turns because context can grow, shrink, summarize, cache, or branch.
The public chart describes paid OpenRouter usage on Hermes Agent. It does not represent all Hermes users, direct-provider traffic, other harnesses, or a controlled model evaluation. OpenRouter’s model catalog prices can also differ from direct-provider terms.
No Vynaris traffic, customer data, telemetry, or routing internals are used here.
FAQ
Is Kimi K3 83% cheaper than Claude Fable 5?
Its observed median is 83.1361% lower in OpenRouter’s 50+ turn Hermes bucket: $4.56 versus $27.04. That is not a quality-adjusted or task-matched saving.
Why is Kimi cheaper than Sonnet in the 50+ bucket despite higher token prices?
The aggregate sessions did not have identical token ledgers. Different workloads, token volumes, cache use, retries, or completion behavior can change the median. The chart cannot isolate which mechanism caused the $4.56 versus $4.79 result.
Can I estimate token count from the session median?
No. Input, cached input, output, and other priced usage have different rates. Many combinations produce the same dollar total.
Which turn band should a buyer monitor first?
Start with 50+ turns. Its median is 72.5758× to 84.4444× the one-turn median across these three models. Then split by accepted outcome so long failed runs do not look productive.
When does this workload not need a router?
Skip routing when one model reliably clears the quality bar, traffic is low, or the measured saving does not repay eval and failure-handling work. A $0.23 observed median gap between Kimi and Sonnet at 50+ turns is not automatically an engineering project.
Sources
- OpenRouter’s cost-per-session announcement and Hermes Agent chart, published 2026-08-17 and captured 2026-08-30: twelve median paid-session cost cells across four turn bands.
- OpenRouter cost-per-session dataset documentation, captured 2026-08-30: median definition, harness isolation, filters, refresh cadence, privacy aggregation, and snapshot metadata.
- OpenRouter live model catalog, captured 2026-08-30: exact model IDs, labels, and current per-token prices.
All arithmetic is reproducible in artifacts/hermes-50-turn-session-cost-kimi-k3-vs-fable-5-math.py. The source files and chart are archived beside it.